


Getty Images
Getty Images
It wasn’t supposed to be like this.
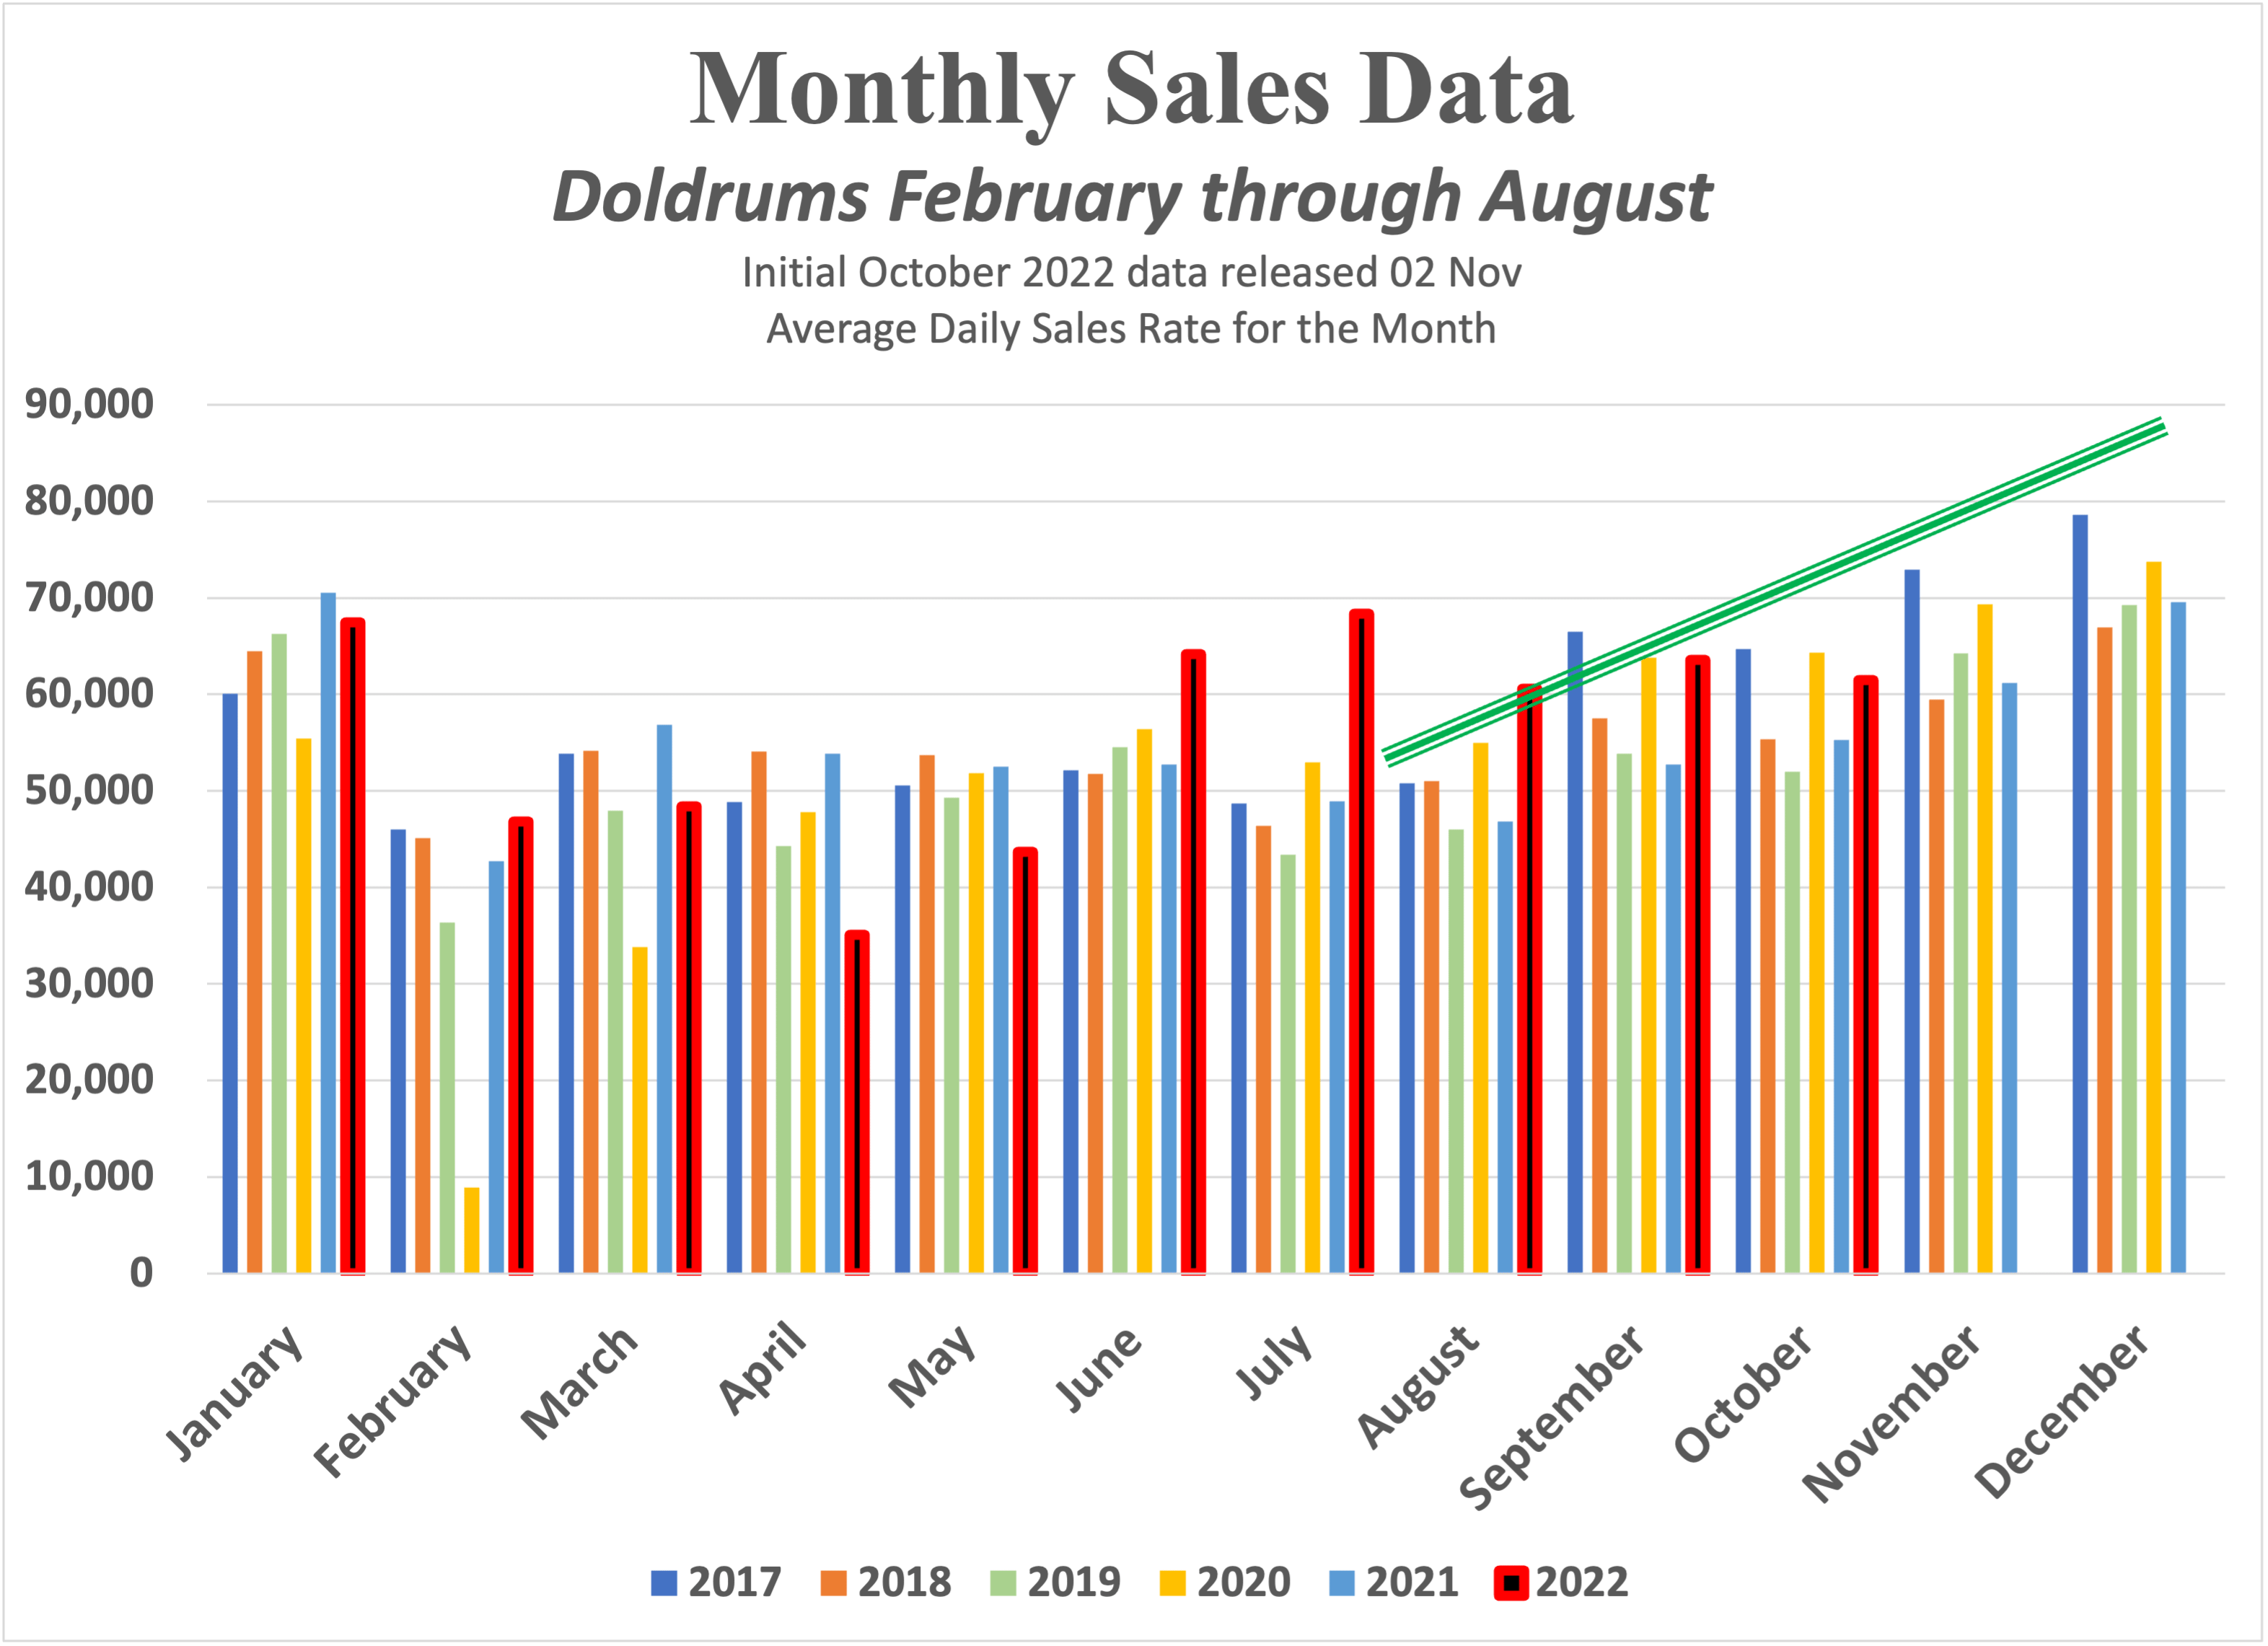
To boost the economy, at the end of March, the Chinese government cut the sales tax for vehicles in half. Assorted local and provincial governments added their own measures, such as a cash-for-clunker policy in Zhejiang Province (where the major car-purchasing and manufacturing cities of Hangzhou, Ningbo, and Wenzhou are located). In addition, there’s a normal seasonal doldrum from February through August, with auto sales rising steadily from September through January.
Data from 车市扫描 reports at cpcaauto.com; author’s calculations.
Data from 车市扫描 reports at cpcaauto.com; author’s calculations.
Data from 车市扫描 reports at cpcaauto.com; author’s calculations.
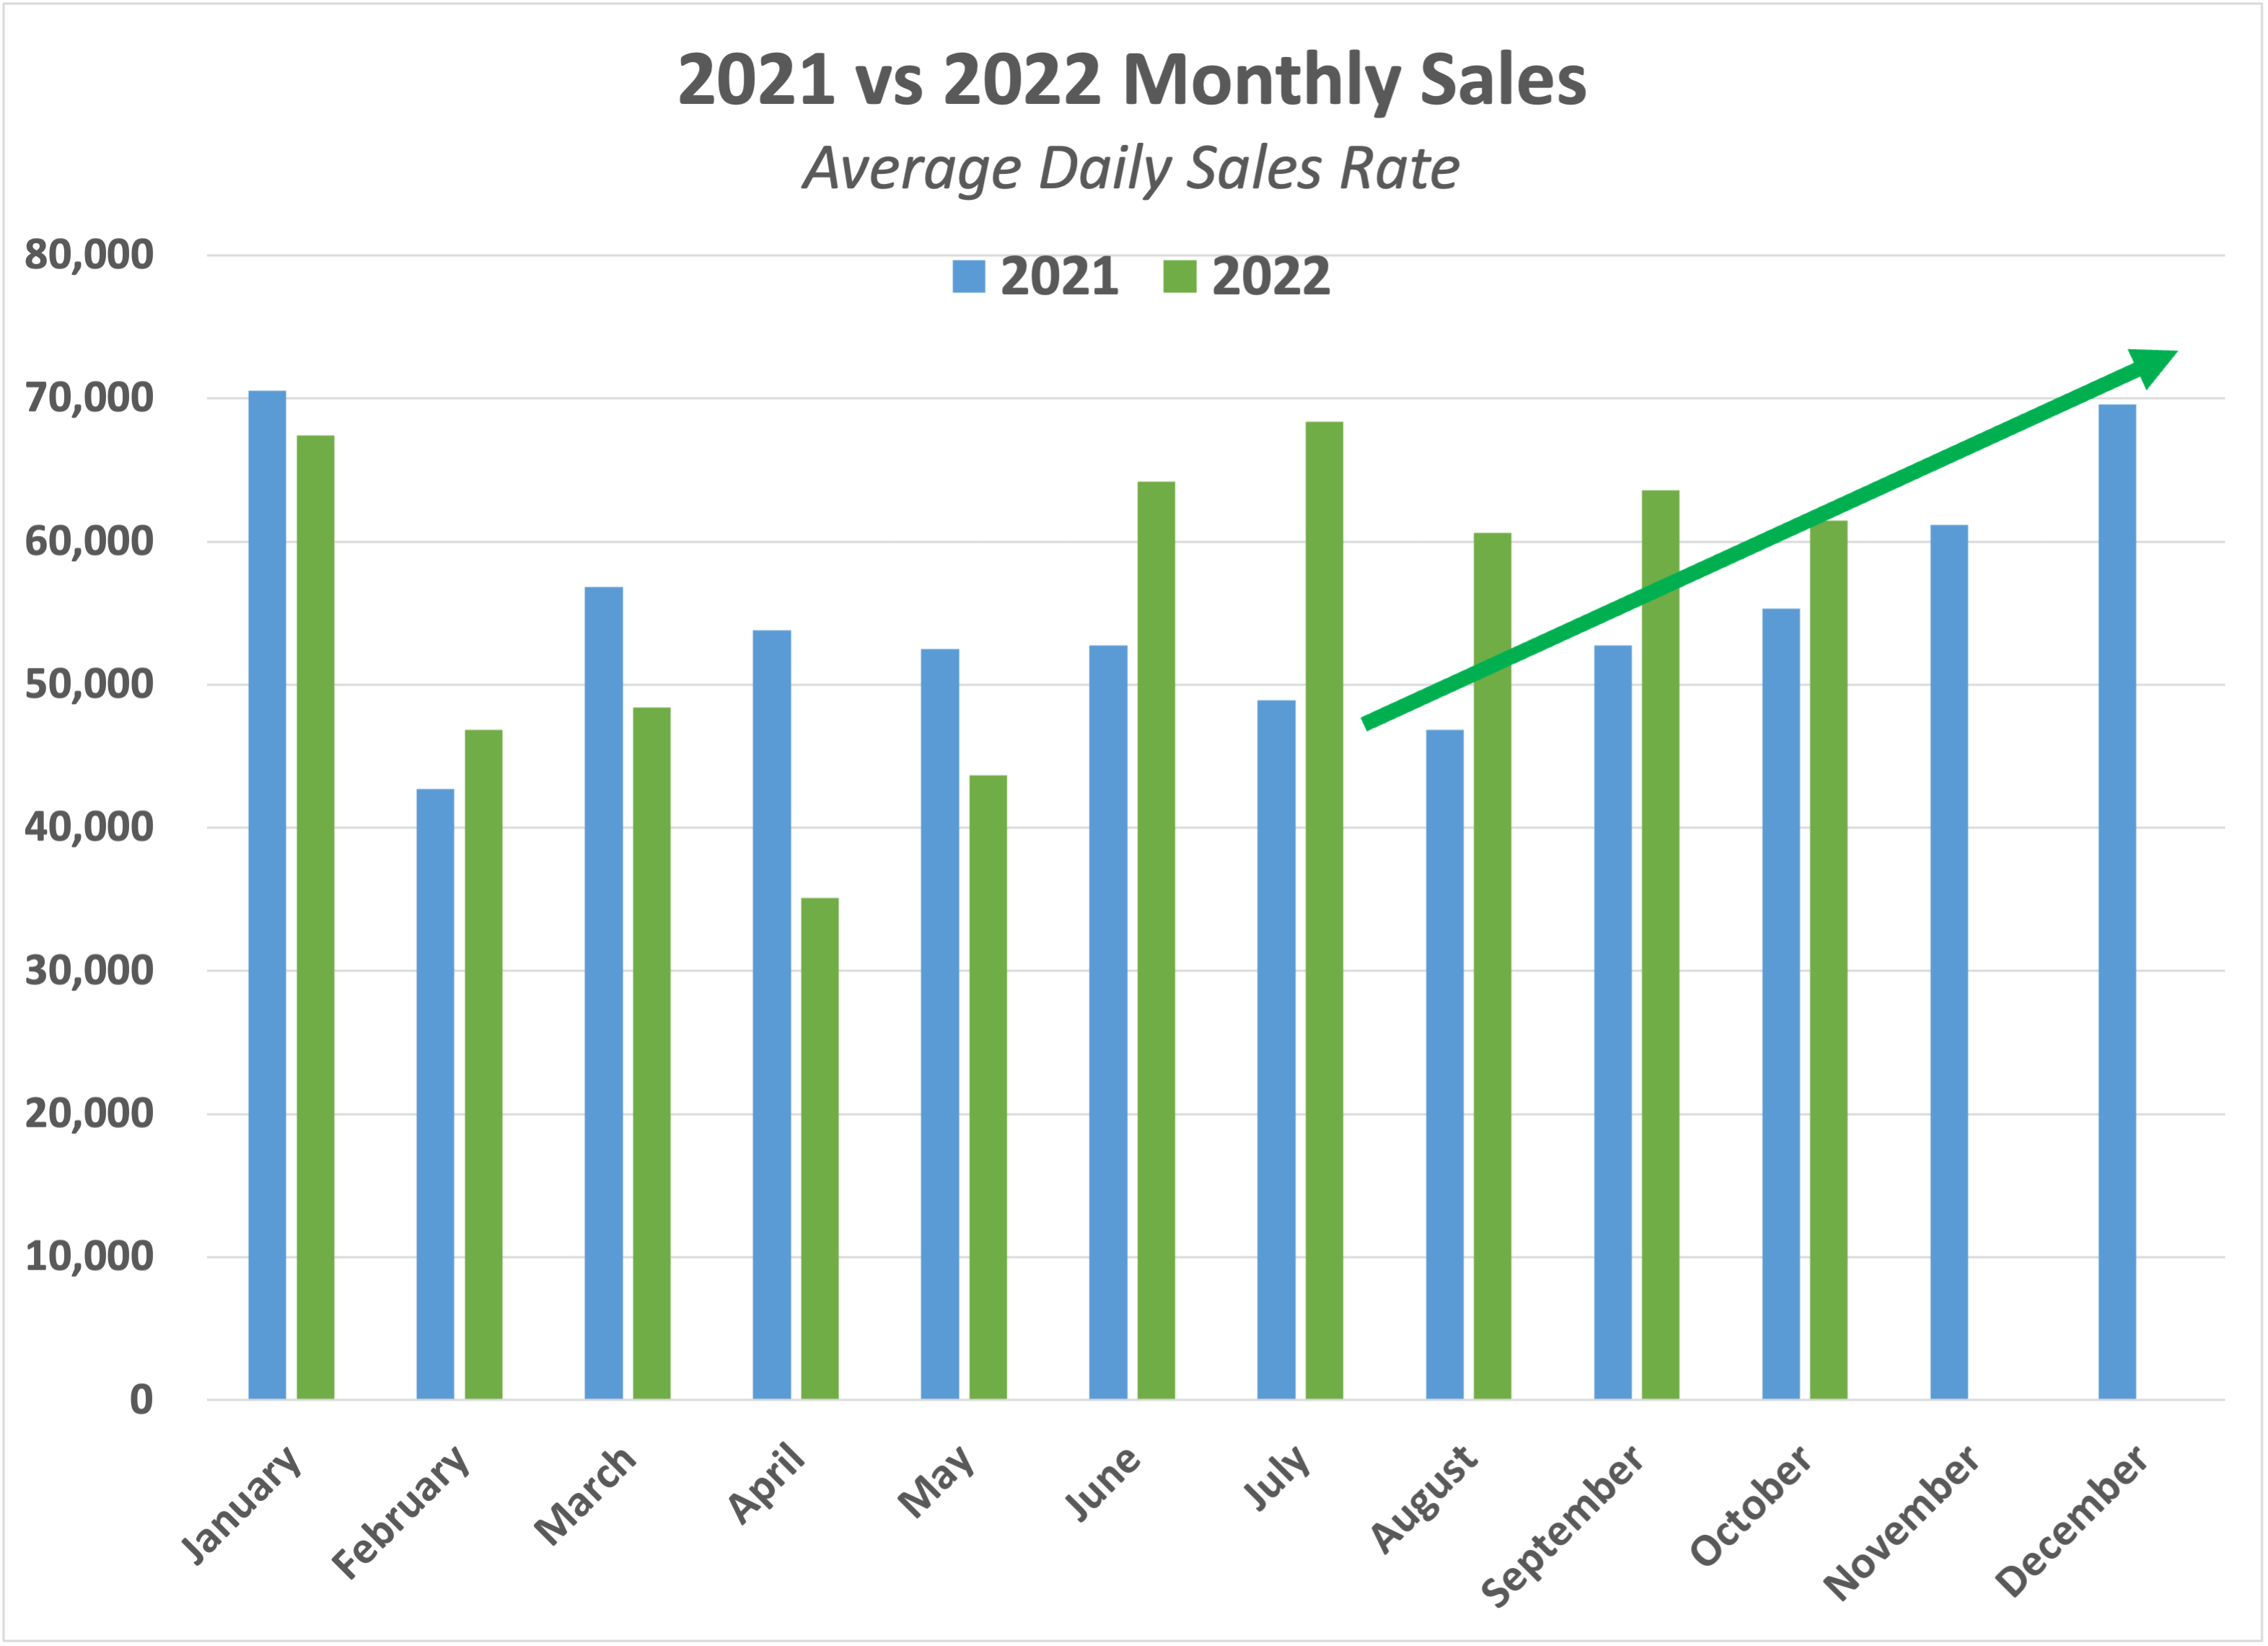
Instead, sales peaked in June and July, while October is below September. See the following two graphs, one for monthly sales from the industry’s peak sales year 2017 through October 2022, and an easier-to-read one for 2021 and 2022. The normal pattern is clear, as is the failure to break out. Stimulus policies have pulled sales forward, and not led to a surge. Data for Nov 1-6 show no rebound. Instead, auto sales are down 2% from 2021 and 27% from the same period in 2020.
Data from 车市扫描 reports at cpcaauto.com; author’s calculations.
Data from 车市扫描 reports at cpcaauto.com; author’s calculations.

Data from 车市扫描 reports at cpcaauto.com; author’s calculations.
Data from 车市扫描 reports at cpcaauto.com; author’s calculations.
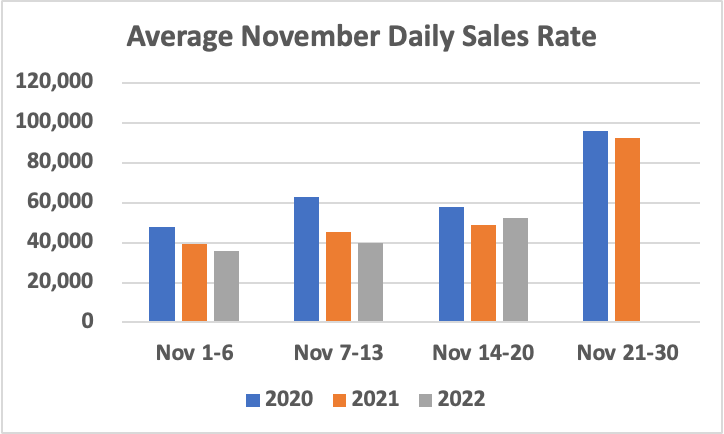
Finally, we now have sales data through Nov 20, 2022. As per the graph below, there’s a strong pattern of end-of-month sales, so the discussion in the CPCA report includes the hope the repressed demand will explode as people are allowed greater freedom of movement. Perhaps, but – as hardly needs mentioning, given headlines the past few days – in China covid isn’t going away, it’s getting worse. Given the shortfall so far this November, the final 10 days would have to average 123,000 daily sales to match November 2020. That’s not going to happen.
Underlying data are from the weekly Chinese Auto Dealers Association sales reports; author’s calculations.
Underlying data are from the weekly Chinese Auto Dealers Association sales reports; author’s calculations.
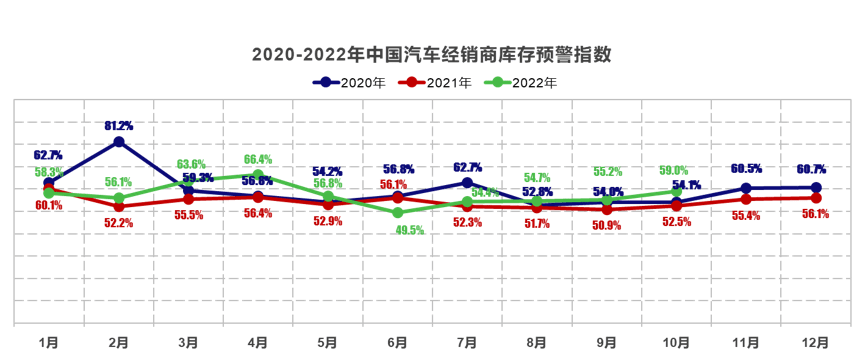
Other indicators point to demand. Dealer sentiment is poor, with a drop of 70 percentage points from 78% in 2021 to 8%; producer sentiment is up with less chip shortages but still below the 50% threshold. Why? – inventories are rising. Inventories were last below the “healthy” 50% level in the second half of 2017, the historic peak of auto sales in China. The inventory level has been above 2021 levels since July, and above 2020 levels since August.
Disaggregated data show it’s consistent across vehicle segments and for all geographies except the West, which is unimportant for overall sales. Nor is it reversing, as production rates remained 6% above sales for the first 13 days of November. That pattern is normal, in preparation for the end-of-year sales surge, but so far no surge is apparent, just the opposite. Again, greater discounts for several producers, and Tesla Inc.’s falling delivery times are widely reported.
CPCA inventory reports, in Chinese
CPCA inventory reports, in Chinese

CPCA inventory reports, in Chinese
CPCA inventory reports, in Chinese
Other data point in the same direction.
Sources: CPCA here and here reporting China Auto Dealer Association data.
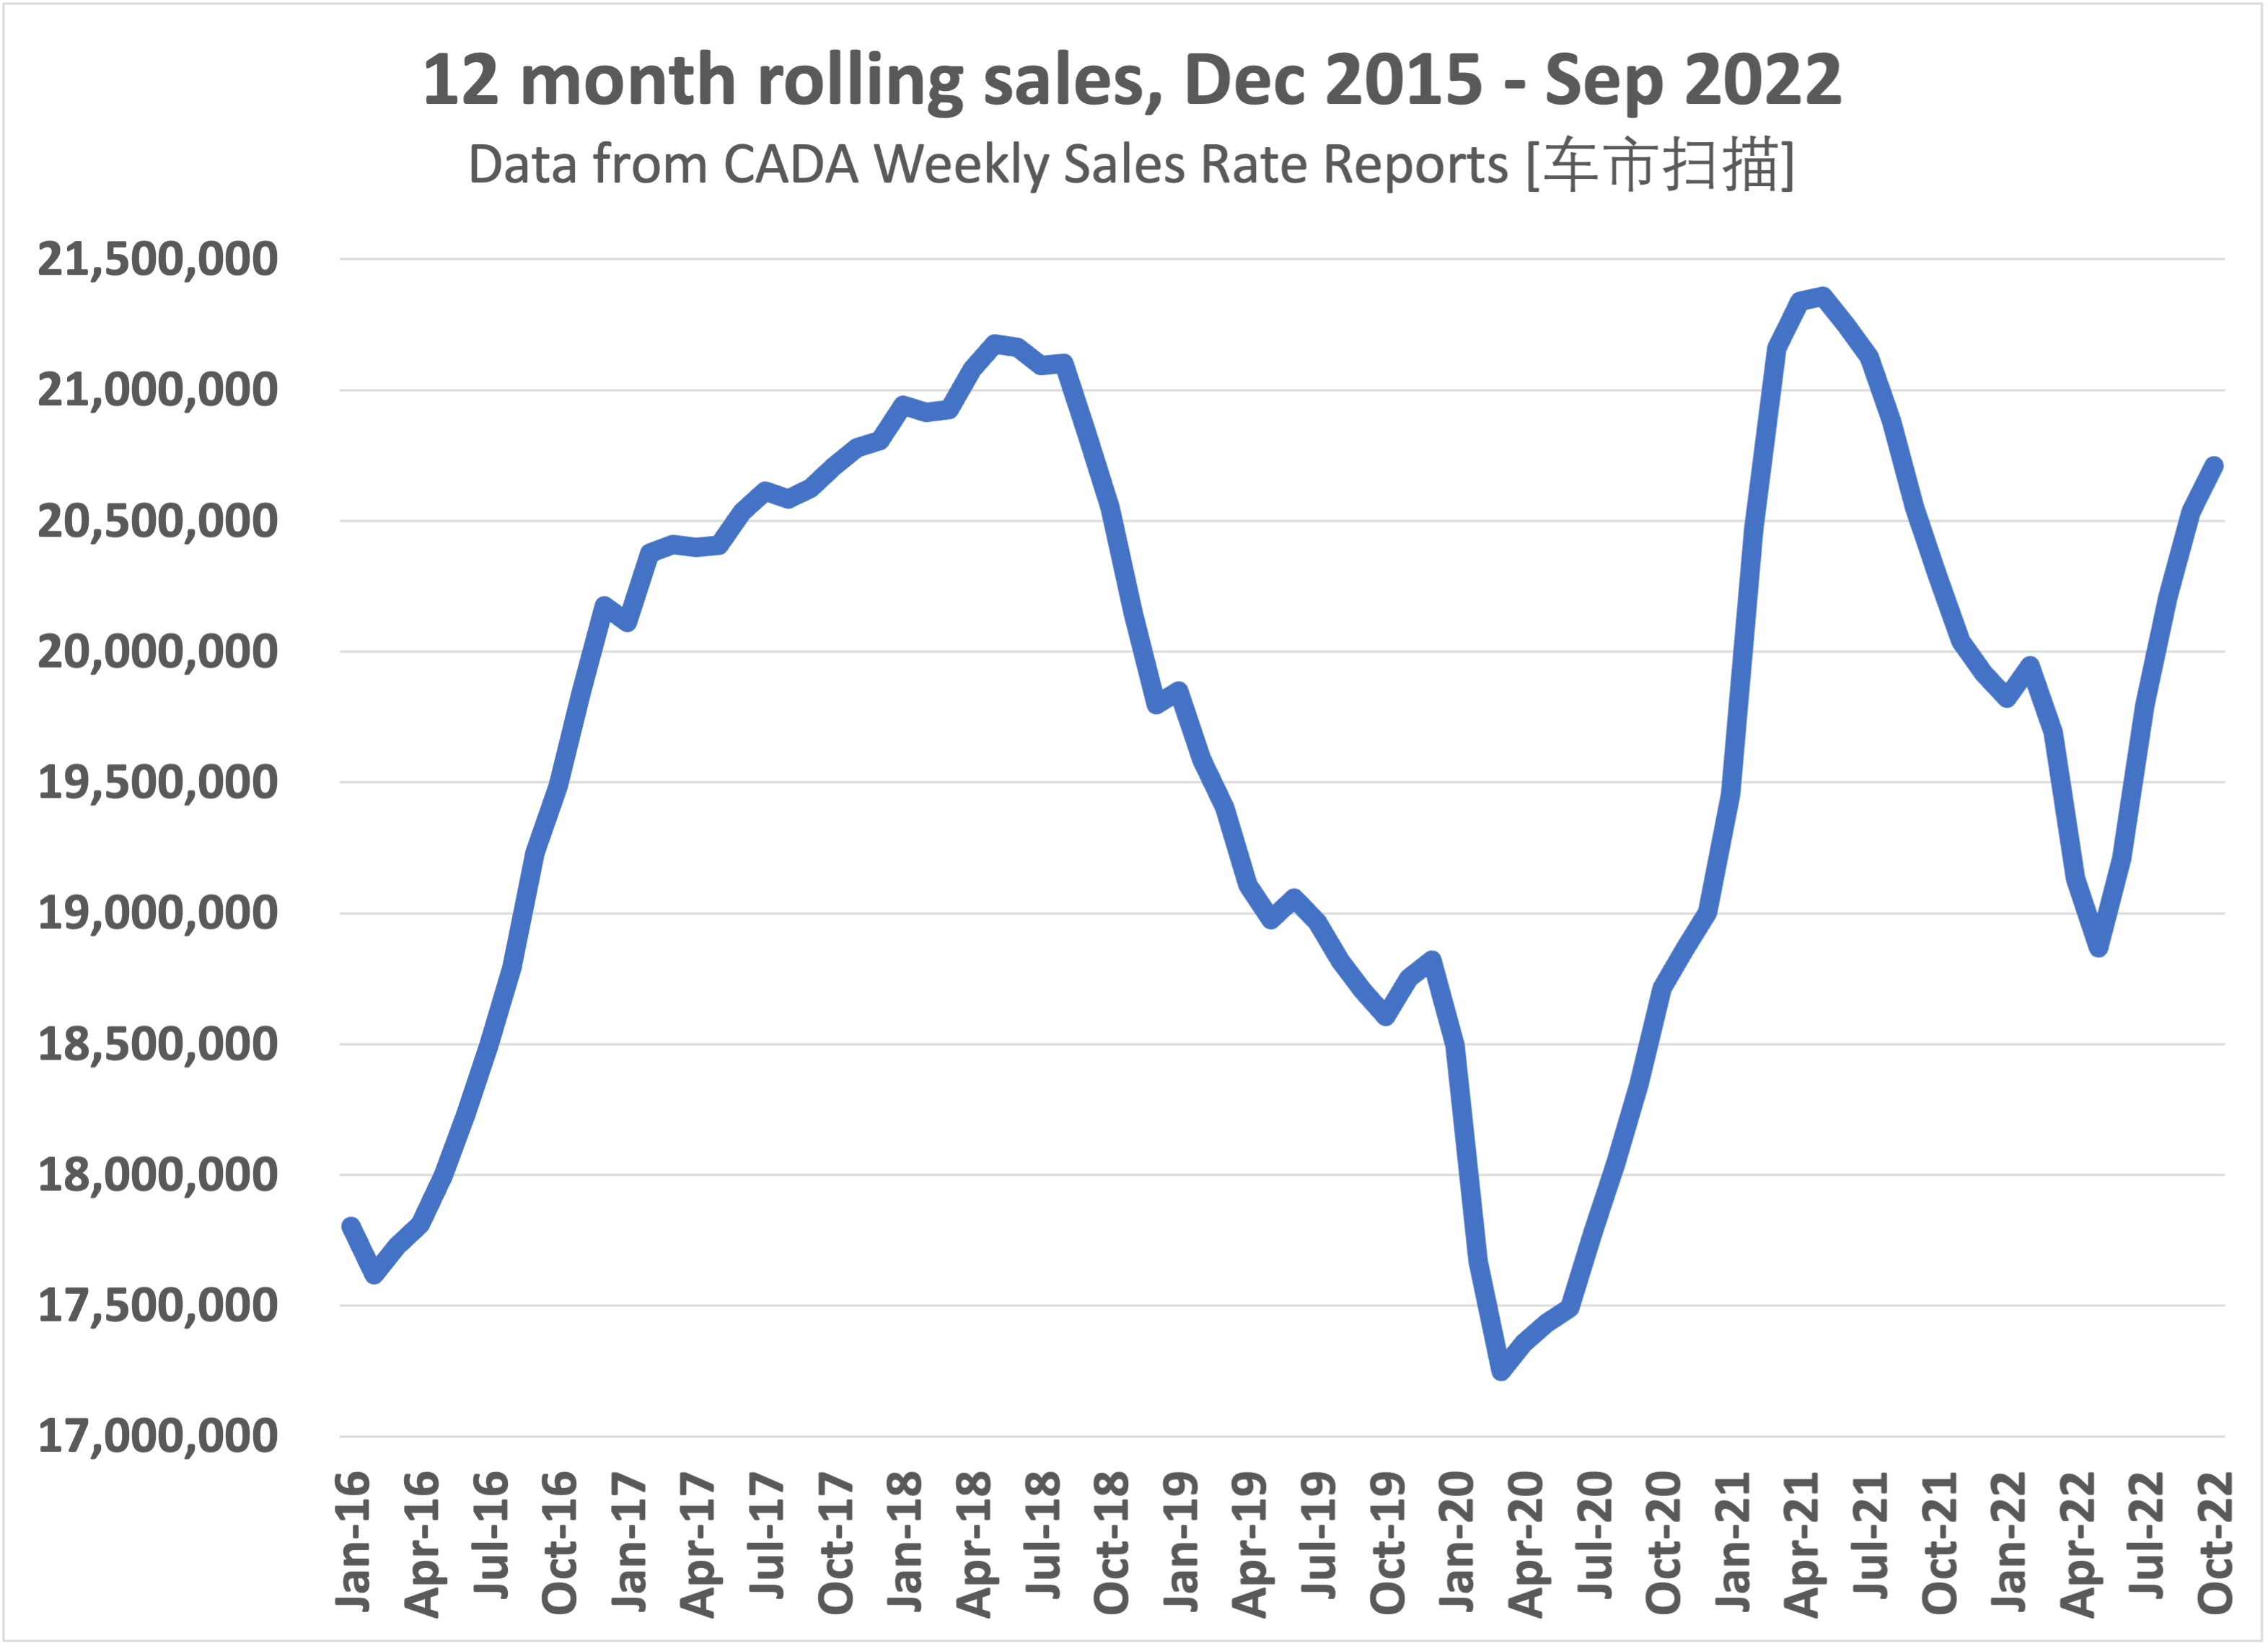
Now these data are by themselves indicative; seasonal patterns aren’t written into stone, and inventories accumulated during lockdowns can fall if postponed purchases lead to a sales surge. Optimists would look at rolling 12-month sales, which shows an uptrend. Given the lack of a summer downturn, cumulative sales in the 12 months through October 2022 are high at 20.7 mil, equal to that in October 2017 but higher than any intervening point.
Author’s compilation from Chinese-language CADA reports
Author’s compilation from Chinese-language CADA reports

CADA weekly sales reports, in Chinese
CADA weekly sales reports, in Chinese
My choice of scale to highlight variations obscures the narrow range; see the second version with a “proper” scale. I played around with the data. If sales rise sharply through the remainder of the year, in a return to past patterns, then sales will nevertheless remain below peak levels. Given covid lockdowns, many consumers will lack the confidence to make a major purchase, even if their particular location isn’t currently in lockdown. After all, they may be next.
In my analysis, President Xi’s “zero-covid” policy is incidental to the public health dilemma. Yes, decisions ultimately rest with him, and by making the control of covid a signature policy, he will damage himself and the Party. However, past policy choices painted him into a corner. But first the key claim: lockdowns will not just continue but intensify, until at some point those fail, leading to months of chaos.
How did China get to this unfortunate situation? The starting point was the SARS outbreak in 2002-2004. Very high mortality rates generated a strong response, and SARS was successfully eliminated – not merely contained – through trace-and-quarantine policies. The memory is deeply ingrained. I was in China for several weeks in 2005, almost 2 years after the last recorded case. Better-class restaurants were still washing plates and utensils in front of you with hot tea. (It was messy, but since the first steeping of tea is always poured out, it wasn’t as wasteful as it might sound.)
To repeat, the panic the SARS outbreak generated, and the success in stamping it out, is ingrained in the training of public health officials and in the memory of all Party members old enough to be in senior positions today, including but not limited to Xi.
But the original SARS virus never spread beyond China, and has not reappeared. Policy wasn’t a relative success, it was a complete success.
Now today’s covid is also a SARS virus, more formally it’s SARS-CoV-2. So what was the initial reaction? Duh, find, trace, and quarantine. With police powers behind the effort, and a good deal of public support, tried-and-true policy stopped another SARS epidemic. The big difference is that while this worked inside China, the virus had already escaped to Korea, Europe and then the U.S., and particularly in the U.S. track-and-trace policies failed abominably.
At that point – say, fall 2020 or winter 2021 – what was China to do? They too had launched a massive vaccination campaign, but because that tried-and-true inactivated virus vaccine had more side effects than the experimental mRNA ones used in the U.S. and Europe, the government didn’t push vaccinations among older Chinese. Nationalism contributed to reliance on an established technology, but so did caution including fears about relying on global supply chains – after all, they needed 1 billion doses for each vaccination round, at a time when countries were threatening to withhold exports. Meanwhile, covid continued to evolve, again not something initially expected. Herd immunity didn’t develop, the U.S. and Europe failed to control the pandemic, and it became clear that vaccines weren’t particularly effective at stopping covid, even if they significantly lowered morbidity and mortality.
China’s population is vulnerable. Over a third of China’s above-60 population are unvaccinated. That’s 100 million extremely vulnerable people. Furthermore, one-sixth of China’s 1.4 billion population have high blood sugar or diabetes, and that ratio is higher in urban areas. That’s 200 million vulnerable people. Third, a huge share of China’s population chain-smoked, and the majority of the urban population lived with horrific air pollution.
Pulmonary disease is rampant. Of course these vulnerable populations overlap, but there are easily 300 million Chinese with co-morbidities. Even if there’s only a 1% mortality rate, that’s millions of deaths. The Washington Post points out that China has only about 5.6 million ICU beds, while, citing Bloomberg Intelligence, in an unchecked epidemic covid patients would 5.8 million beds. Worse, the majority of those beds are in the richest cities, but the majority of the urban population lives in the 100+ cities with populations of only 1-3 million. China has had two and a half years to push vaccinations and add hospital space. That didn’t happen.
So yes, Xi has “skin in the game,” but he also has no good options, only very bad and truly horrific ones. He can intensify lockdowns, or he can let the pandemic roar through a densely settled, relatively unprotected population. Mortality aside, that will overwhelm the healthcare system, and create widespread panic that police and censoring won’t be able to stop.
As of November 25, cities with partial or complete lockdowns include Guangzhou, Zhengzhou, Chongqing and Urumqi, while there are increased restrictions in Shanghai, Shenyang and Beijing. To reiterate, lockdowns will continue indefinitely, until at some point they will cease to be effective. China may already be at that point. For those wanting more detail, here’s one good discussion in the Washington Post.
As long as lockdowns continue, car sales will lag. When lockdowns fail, the economy will go through a full-fledged crisis and car sales will collapse. At best, that will last 6 months. So things will remain in turmoil until late 2023.
The best may not happen.
To finance growth, China leveraged a regulated banking system to cap interest rates on deposits and hence keep lending rates low. Such “financial repression” was also present in the U.S. into the 1980s, and in Japan into the 1990s. One side effect is to push savings into alternative investments, in the hopes of earning returns above inflation. Another was to direct those savings to larger firms – as banks had no experienced staff, they lacked the institutional capability to lend to small businesses.
Now in the 1990s, as reforms kicked in, families had paltry savings. Savings while young and still poor didn’t add up to much in the face of rising living standards. With returns below inflation, savers had to run to stay in place. Second, they had to save a lot, because for most Chinese there’s no social security system or robust public healthcare. Third, after two generations of low fertility, parents couldn’t rely upon children. After all, a single child of single children can’t afford to support two parents and four grandparents! Such catch-up savings remain extraordinarily high, at a staggering one-third of average household income.
Over time, financial repression pushed aggressive savers first and foremost into real estate, secondarily into investment trusts, and finally into many scams and pyramid schemes. There was scant government oversight – remember (well, I do!) that in China in 1990, modern banking and accounting didn’t exist. I won’t elaborate on investment trusts, which are tied to local government finance. Suffice it to say that local governments are broke, and struggle to pay for mandatory covid testing. They can’t repay their loans from “local government financial vehicles,” which means that investment trusts and the small banks that peddled them are at best illiquid and often insolvent. Readers can google the latest bank run.
Back to real estate. Developers would put together a condo project, and prior to construction market units to households looking for a “hard” asset with good returns. Purchasers had to ante up a substantial down payment to get a mortgage – with monthly payments starting before construction commenced. But farm to city migration is at an end, incomes are rising more slowly, and there’s already a large stock of housing.
Many developers are poorly capitalized, and so depend on sales of new units to finance the completion of units already sold. New units aren’t selling – you can’t be selling housing as an alternative to bank savings when prices are falling – and so, in Tier III and Tier IV cities, all too many developers have run out of money and stopped construction. Crucially, those who purchased those condos continue to face mortgage payments.
Falling real estate prices are dissipating the savings of urban households that might otherwise be used to buy a car. Sharply lower equity prices are adding insult to injury. The best discussion is a recent NBER paper by Kenneth Rogoff and Yuanchen Yang. 2022. “A Tale of Tier 3 Cities,” readily available to academics but otherwise behind a paywall. To summarize their findings, the majority of China’s population and economy are in Tier III-IV cities, the 100-plus urban areas with merely a million or two residents. These cities are already built up, or are actually shrinking in population.
The policy response is to encourage banks to pour more money into zombie real estate firms, and to “evergreen” the associated bad loans. In the short run, some developers may get enough cash to resume construction, but the government can’t force consumers to sink their savings into purchasing additional condos. I’ve seen this before, as I was studying urban systems in Tokyo in 1991-2, when their real estate bubble popped; parts of the banking system collapsed, and 30 years later, prices of both real estate and equities remain far below peak. (I don’t need to elaborate on the Great Recession, from which the U.S. needed a dozen years to recover.)
In sum, the economy is taking a huge hit. Unlike in 2008, when urbanization was in full swing, few expressways existed, today’s high-speed rail network was only a dream, and local governments had little debt, Beijing will no longer be able to mobilize the Great Proletariat Construction State to maintain growth.
Investors beware.
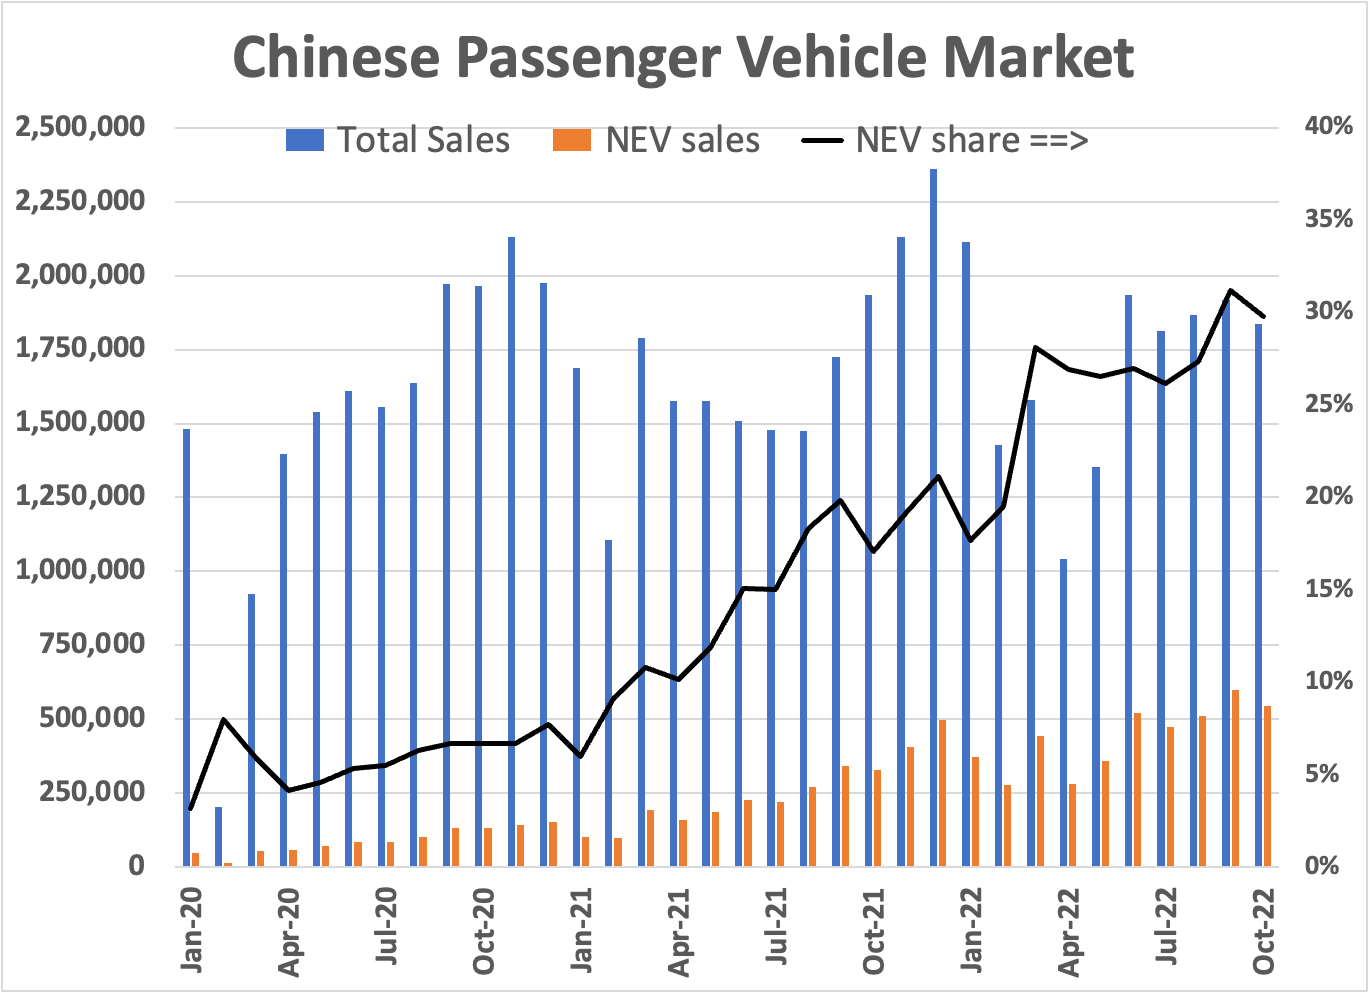
Now, even if the overall new vehicle market remains moribund, that won’t necessarily apply to EVs and PHEVs. After all, the New Energy Vehicle market has been expanding rapidly, and that can potentially offset poor overall vehicle sales. However, two pieces of data suggest such growth may be insufficient to keep the NEV share expanding rapidly.
First, since jumping in March, the expansion of the NEV share had decelerated, and actually fell in October 2022. (I use data from 车主指南 [icauto.com.cn]. Including discontinued models, I track 728 models, of which data on have categorized those by drivetrain types, brand, manufacturer, size segment and price bracket. Other sources will vary in details, depending on how they treat vans and dual-use light commercial vehicles, and how quickly they incorporate newly launched models.)
Author’s database, compiled from 车主指南 and other sources.
Author’s database, compiled from 车主指南 and other sources.

Author’s database, compiled from 车主指南 and other sources.
Author’s database, compiled from 车主指南 and other sources.
Author’s database, compiled from 车主指南 and other sources.
Second, pure EV startups have to date failed to achieve scale, and most are no longer growing. This could be hiccups stemming from value chain issues, from chip shortages on the upstream side to lockdowns preventing consumer deliveries on the other. However, with factories scattered across China, there should be more exceptions if that is the case. Instead, what we see is BYD gaining share at the expense of everyone else. (Note: GAC (OTCPK:GNZUF) is not a pure EV play, plus it’s owned by the Guangzhou Municipal Government, but it is the best performer among the government-controlled car companies.)
Firm
Oct 2022
Recent
Peak
Change
peak
month
from peak
Tesla*
13,725
77,928
June:
-82%
Weltmeister
1,117
4,567
Aug:
-76%
XPeng (XPEV)
5,101
15,295
June:
-67%
Leap
7,026
12,044
Aug:
-42%
Li (LI)
10,052
13,024
June:
-23%
Nio (NIO)
10,059
12,961
June:
-22%
GM Wuling** (GM)
43,712
46,791
Mar:
-7%
Aion [GAC EV brand]
30,063
30,016
Sept:
+0%
Neta [Hozon]
18,016
18,005
Sept:
+0%
Seres
12,047
10,098
Sept:
+19%
BYD*** (OTCPK:BYDDY)
217,518
168,885
Sept:
+29%
Note: * Tesla excludes exports **GM Wuling only sells “micro” EVs
*** BYD figures may include ≈10,000 monthly exports
Sources: Author’s database, Gasgoo and ICAuto sales reports.
The Chinese-language automotive press is now running articles questioning which of these firms will survive; this one questions the viability of Weltmeister, but mentions others in passing: 威马汽车全员降薪!新势力过冬,各显“神通”?
Qualitatively, too, the easy inroads have been made. In Shenzhen, 100% of taxis, local government passenger vehicles, and buses are now NEVs; Shanghai and others likewise pressure regulated and government fleets to turn to EVs. Meanwhile, incentives can’t overcome the challenges apartment dwellers face in charging EVs, and of course that as in the U.S., new vehicles are beyond the reach of the average consumer.
Warren Buffet was an early foreign investor in BYD (OTCPK:BYDDF, OTCPK:BYDDY), a private company. He’s now sold two large blocks, and may have sold additional amounts not yet reported in Berkshire Hathaway filings (BRK.A, BRK.B). While I personally am watching Great Wall (OTCPK:GWLLF) and Geely Automobile Holdings Limited (OTCPK:GELYF, [GELYY]]), I had not reached the point of buying shares. I won’t do so now.
The publicly traded EV standalones in my table above are particularly to be avoided: Li Auto Inc. (LI), XPeng Inc. (XPEV), and NIO Inc. (NIO). My database includes 70-odd firms, and many more brands. Numbers of Chinese automotive firms are either not publicly traded, or are only traded on Chinese exchanges and/or most shares are held by governmental entities, which in my opinion militates against holding their shares.
What about non-Chinese players with a major presence in China? Those include VW, GM, Toyota, Honda, Nissan, BMW, Mercedes, Porsche and Tesla.
Note that quantifying profits is hard. BMW now controls approximately 75% of its joint venture with Brilliance, and Honda has a controlling stake in one of its ventures, as does VW in Anhui Province. However, they don’t break out China as a geographic segment. At best, they provide information in their investor presentations on gains in their joint equity valuations. That does not include profits from IP licensing, parts exports, finished vehicle exports and financing. Tesla could more readily break out its China operations, since their Shanghai plant is wholly owned, but they do not do so.
In closing, my apologies for not posting this 2 weeks ago, as I was traveling in the Philippines, and was truly on vacation. While material only for Tesla, China is becoming a major automotive exporter. In the Philippines, I passed dealerships of Geely, Changan, and SAIC (carrying the MG brand). EV motorcycles and buses are present in small numbers, but with power prone to weeks-long interruptions from typhoons, and taxi & Grab ride-hailing operators not always having access to parking at their residence, the biggest well-defined market avoids EVs. That’s common across much of the world, and as U.S./EU car companies go all-in on EVs, it will leave this large and growing market to their Chinese, Japanese, and Korean rivals.
Major Players by Firm, Jan-Oct 2022 Retail Sales
VW Group
2,503,303
of which Audi
506,613
GM Group
1,468,389
Toyota
1,402,267
BYD
1,364,913
Honda
1,249,945
Geely Group
1,132,837
Changan (OTC:CMGLF)
1,029,965
Nissan (OTCPK:NSANY)
828,245
Great Wall
664,521
Chery
561,035
BMW
538,171
GAC
502,738
of which Aion
214,985
Mercedes
400,792
SAIC
388,774
Tesla
330,469
Dongfeng
323,301
Hyundai Group (OTCPK:HYMTF)
280,432
Ford, Stellantis, Renault
also-rans
Source: Author’s categorization of multiple brands. Fifty-plus smaller players not reported.
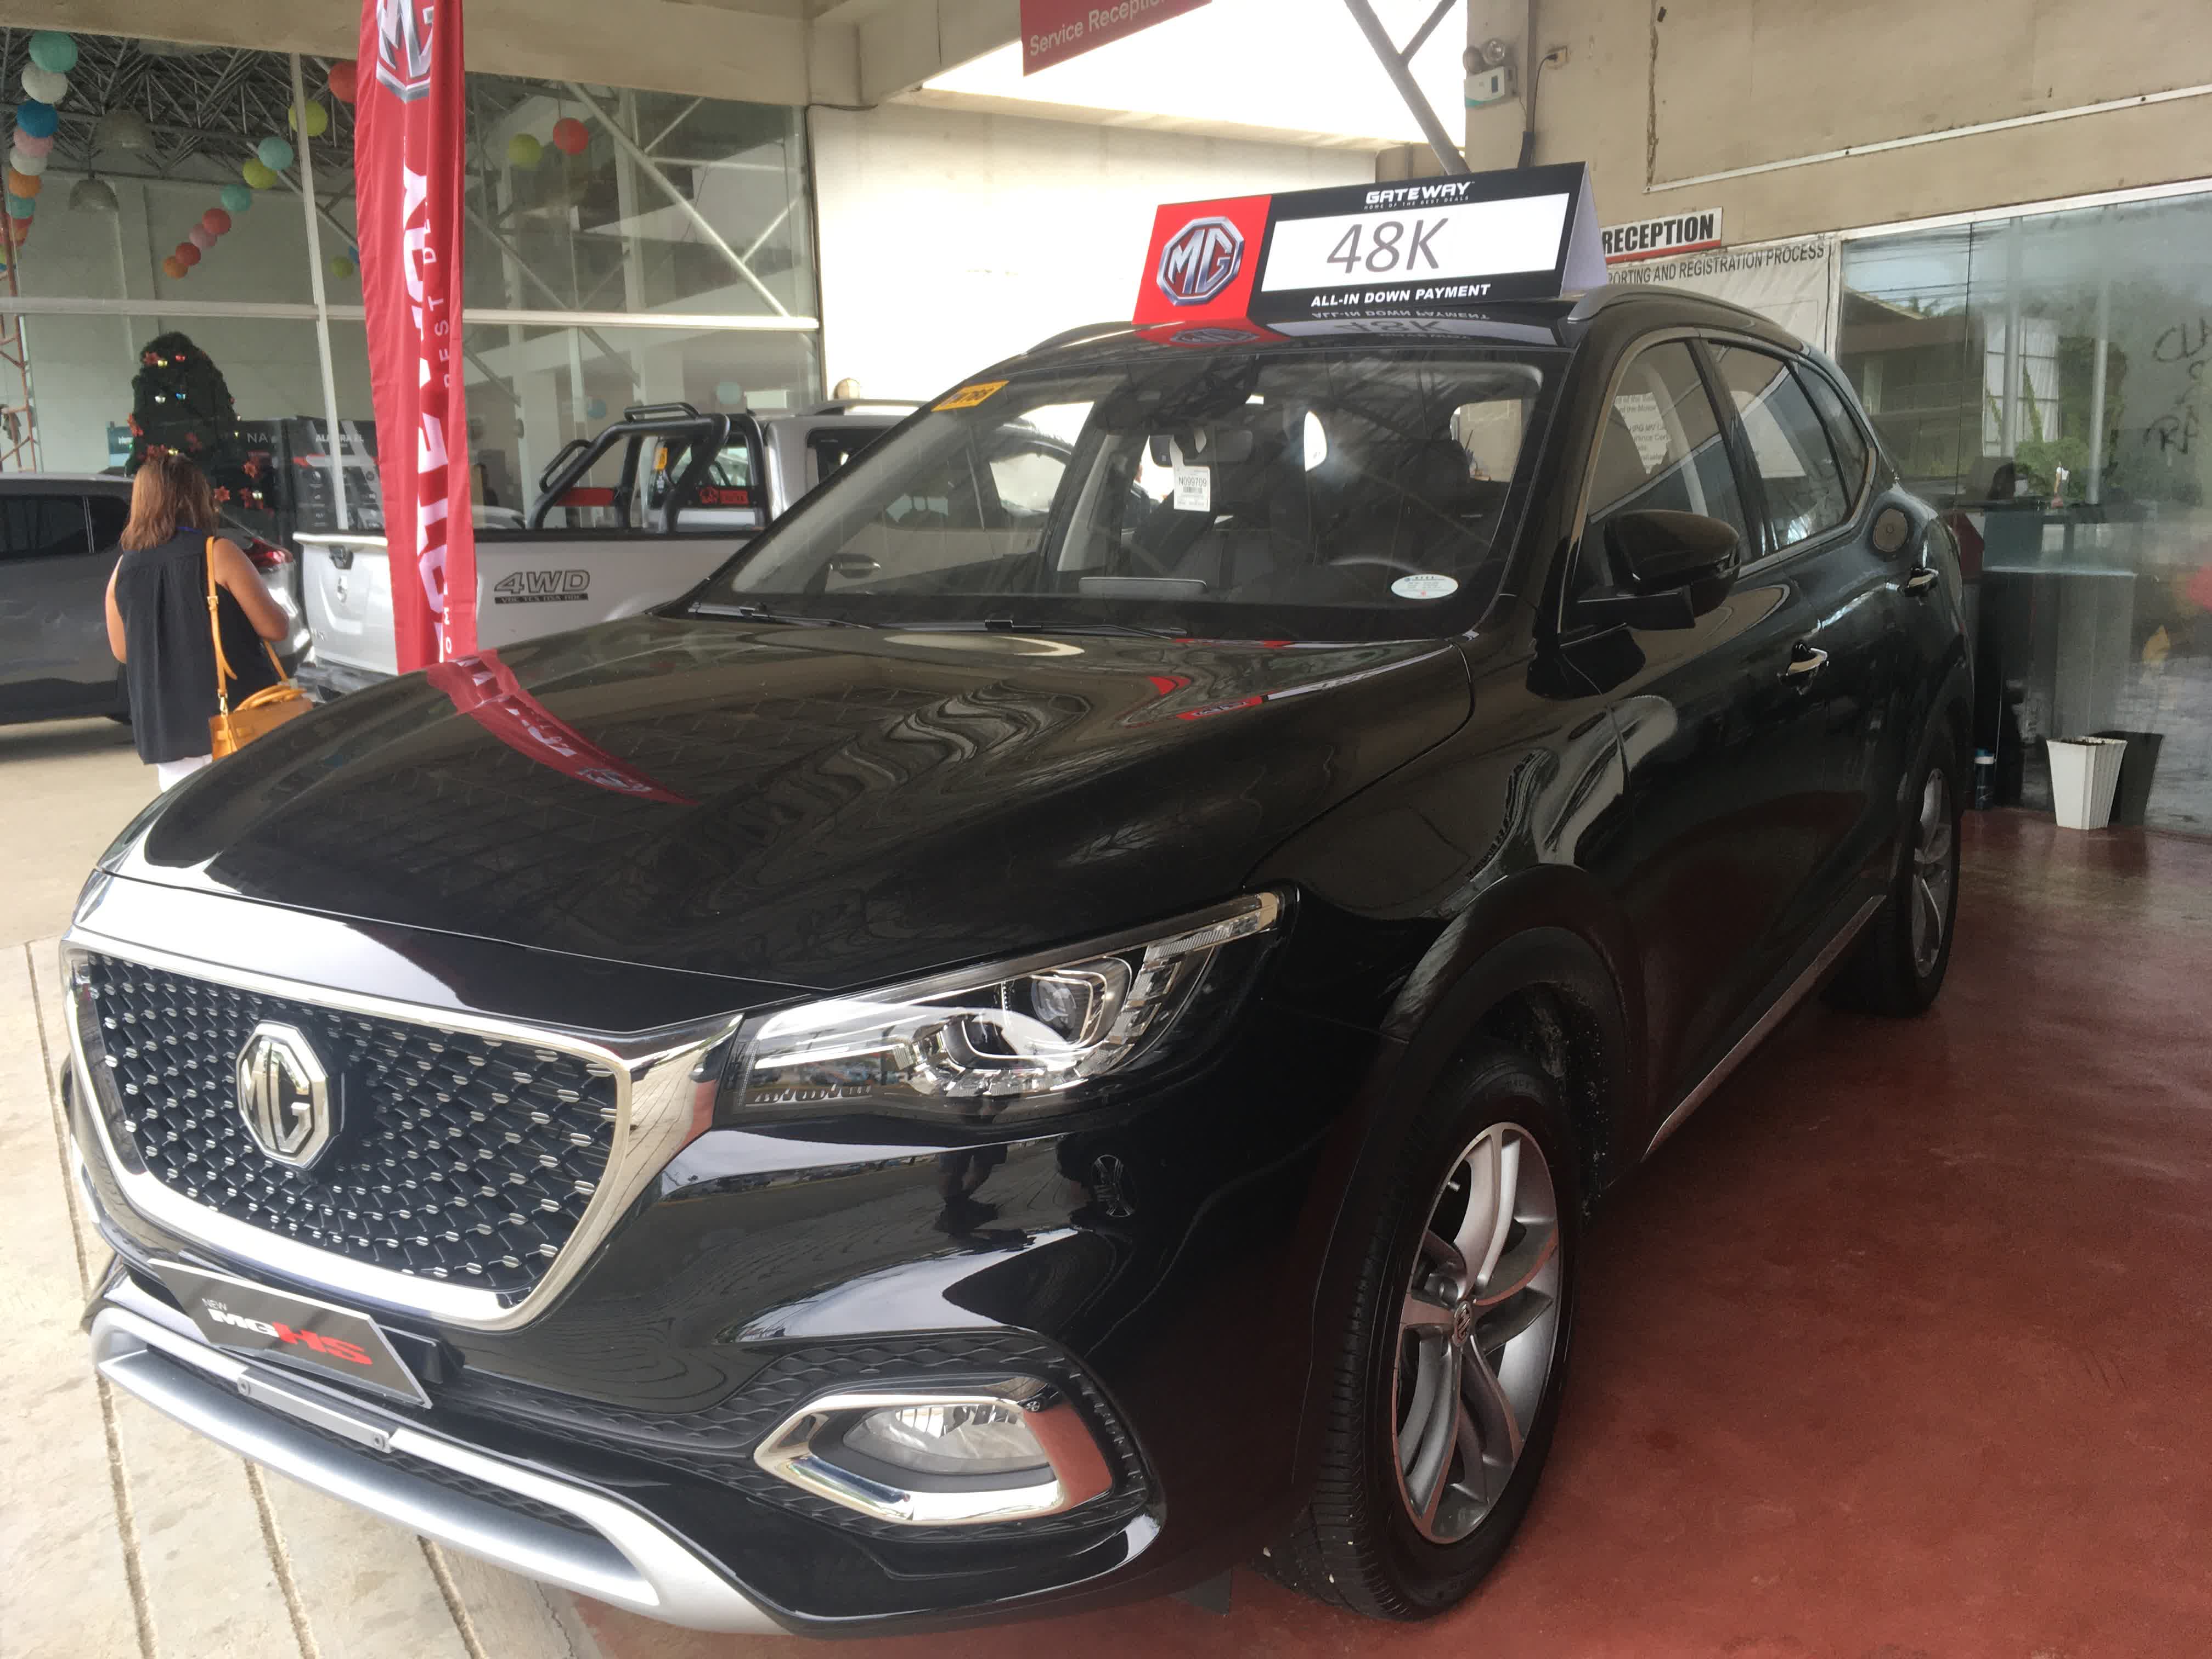
Here is an MG at a recently opened dealership in Puerto Princesa, Palawan, an island with a population of about 1 million. The brand proudly displays a British logo on the rear, but is now owned and manufactured by SAIC in Shanghai. The fit and finish was pristine, the interior less laden with knobs and buttons than the Nissans displayed next door and its large display was cleanly integrated into the instrument panel. It’s priced aggressively – the price (P48,000 at P56/US$) is the minimum down payment, with up to 5 year financing. As a new brand – 2 months in the local market – both the dealer and SAIC are working to bolster brand recognition, with displays in the local malls that higher-income locals frequent. They are in it for the long haul.
Author’s photo
Author’s photo
In the Philippines, Toyota is the dominant player, and the Ford Ranger pickup sells well. But there are also imports of used Suzukis (OTCPK:SZKMF) from Japan – I’ve visited a used car auction in Osaka – that are retrofitted into very small utility vehicles, in an architecture new to me (4WD with 2 seats up front, 2 passenger benches under the roof in back, plus a small cargo area). Maybe I’ll end up owning one – I bought a fistful of raffle tickets for this one at the Catholic church in Bilar, Bohol.

Author’s photo
Author’s photo
This article was written by
Disclosure: I/we have no stock, option or similar derivative position in any of the companies mentioned, and no plans to initiate any such positions within the next 72 hours. I wrote this article myself, and it expresses my own opinions. I am not receiving compensation for it (other than from Seeking Alpha). I have no business relationship with any company whose stock is mentioned in this article.